Difference between revisions of "Producing Reports Using IMSMANG"
| Line 1: | Line 1: | ||
| − | {{Reference guide header|A ''report'' presents your data in | + | {{Reference guide header|A ''report'' presents your data in a specified format and layout. You can design the ''report template'' that you want [[Use i-Report|using the iReport Designer]] integrated into {{IMSMANG}}. It can then be printed or produced in PDF format. Starting from {{IMSMANG}} v6.0, the printing from inside {{IMSMANG}} is also implemented via iReport. |
| − | A report is designed to ''run'' on your dataset by selecting a ''target category'' such as | + | A report is designed to ''run'' on your dataset by selecting a ''target category'' such as land, activities or organisations. A report target can be narrowed to a ''saved search''. |
Frequently used reports can be ''saved''. Saved reports will always use the current data when they are launched. You can access your saved reports from the IMSMA Navigation window menu bar for ''Reports''. | Frequently used reports can be ''saved''. Saved reports will always use the current data when they are launched. You can access your saved reports from the IMSMA Navigation window menu bar for ''Reports''. | ||
Revision as of 16:06, 12 September 2013
A report is designed to run on your dataset by selecting a target category such as land, activities or organisations. A report target can be narrowed to a saved search.
Frequently used reports can be saved. Saved reports will always use the current data when they are launched. You can access your saved reports from the IMSMA Navigation window menu bar for Reports.
A report presents your data in relevant formats and layouts. You can design the report template that you want using the report designer. It can then be printed or produced in PDF format.
A report is designed to run on your dataset by selecting a target category such as hazards, field activities or organisations. A report target can be narrowed to a saved search.
Frequently used reports can be saved. Saved reports will always use the current data when they are launched. You can access your saved reports from the IMSMA Navigation window menu bar for Reports.
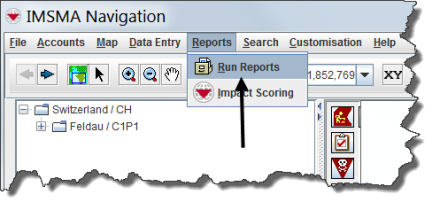
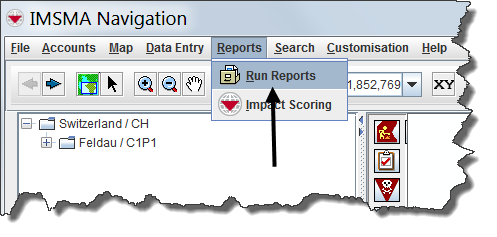
- Choose Reports > Reports.
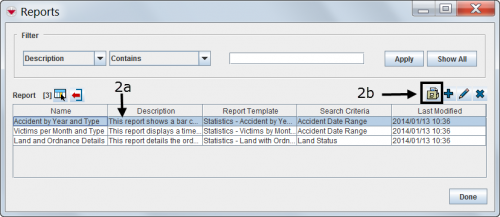
- Select the report you want to run and click File:Select the Report.png .
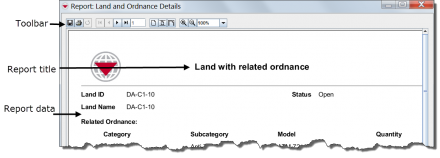
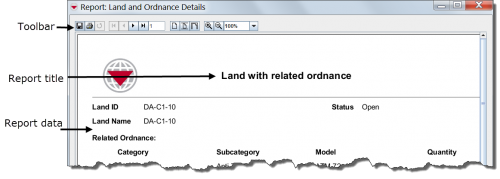
Looking at the Report Results

File:Looking at the Report Results2.png
Running a Saved Report
- Choose Reports > Reports.
- Select the report you want to run and click 25px
Looking at the Report Results
If you see this message it means that no data exists for this report.

Running a Saved Report with a Saved Search
- Choose Reports > Reports.
- Select the report you want to run and click File:Pencil.png
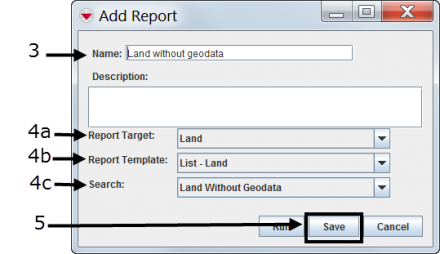
- Enter the report name in the Name field.
- Choose a report target, report template and search from the drop-down lists.
- Click Save.
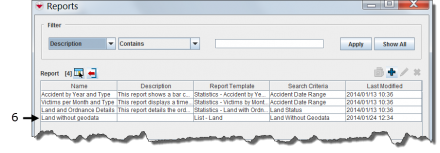
- Verify that the report has been added to the Reports window.
Save an Existing Report with a Saved Search
- Choose Reports > Reports.
- Select the report you want to run and click File:Pencil.png
- Enter the report name in the Name field.
- Choose a report target, report template and search from the drop-down lists.
- Click Save.
- Verify that the report has been added to the Reports window.
