Creating Ad Hoc Views in MINT
| This page is under construction |
What is an ad hoc view?
The ad hoc editor allows the ad hoc exploration of data - typically the data from a Domain. It is meant for users who would like to explore data, as opposed to running a pre-defined report that allows for only little interactivity.
Create an Ad Hoc View
To create an ad hoc view:
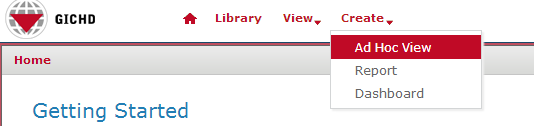
- In the top-level menu, choose Create → Ad Hoc View
- In the Select Data window, select the data the Ad Hoc View should be based on - this can be either a domain or a topic. In the Select Data window it is possible to switch between a list and a tree view by clicking on the respective icon in the top left corner. The list view provides a list of all available domains and topics in a flat structure (including those from the Public folder, if any), whereas the tree view presents them according to the repository folder structure. Select a domain or topic and click on Choose Data....
List view: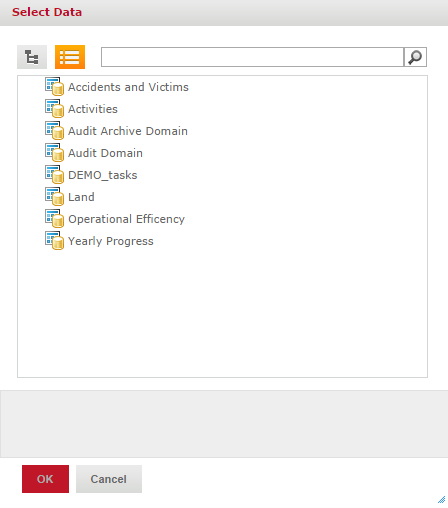
- In the next step, from all the attributes available from the chosen domain/topic, select all those that should be included in the ad hoc view. Attributes can either be double-clicked or dragged and dropped to the right-hand pane named Selected Fields. Of course, if required, all available attributes can be selected.
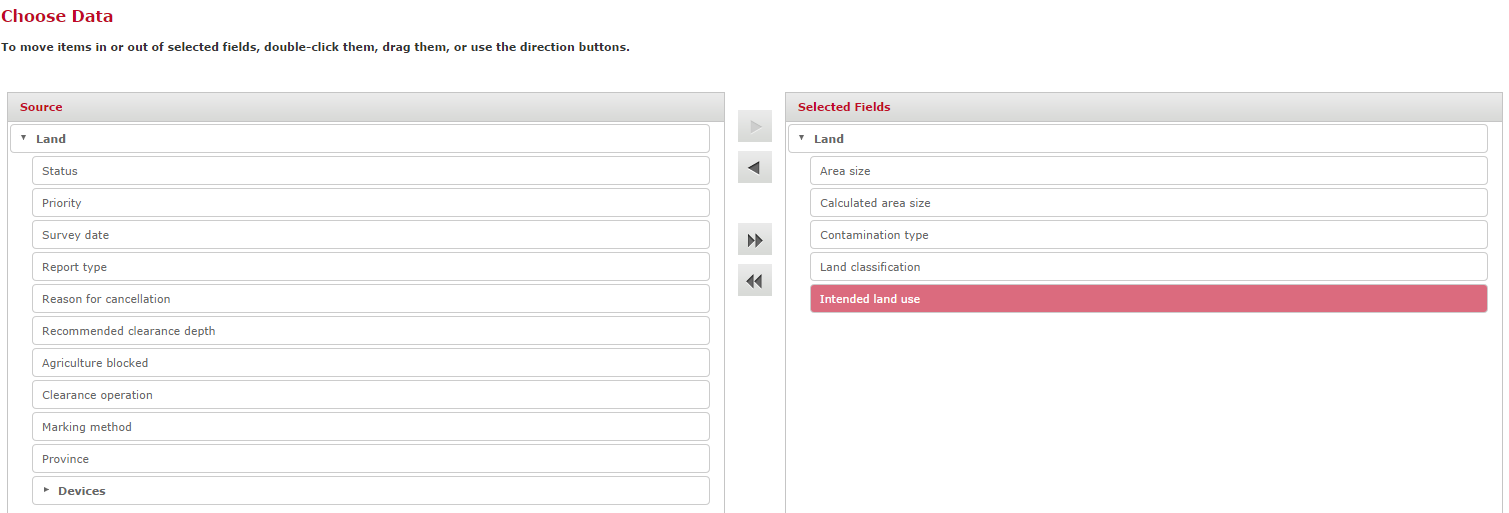
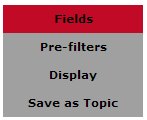
- Additional (optional) options can be specified at this stage:
- Pre-Filters: the data for the ad hoc view can be filtered on any available attribute - for example, only accidents that happened in a specified date range could be considered
- Display: the order of appearance of the attributes can be changed, for example for ordering them logically
- Save as Topic: the specified selection of attributes, pre-filters and displays can be saved as another object type called Topic. A topic can also be the basis for an ad-hoc view.
- Finally, click OK to validate the selection and proceed to the Ad Hoc Editor.


Tree view:


The Ad Hoc Editor

Fields and Measures
Attributes available in the ad hoc interface (in the left-hand pane) are divided into two categories: fields and measures. Fields are non-numeric attributes, such as text and date, and measures are numeric attributes. The reason for the separation is that different operations/manipulations can be applied to these sets. In particular, custom fields can be created based on measures to which pre-defined functions are applied.
Create a new calculated measure
To create a new calculated measure, click on the small icon/arrow in the heading of the measures pane and select Create Calculated Measure....

In the Calculated Measure window, the desired calculated field can be created by either entering a formula manually into the Formula text box, or by double-clicking on available attributes and functions and clicking on the proposed mathematical and logical operators such as +, AND, etc. The following example shows the calculation of the percentage difference between the manually entered area size of a land and the area calculated based on the polygon defined for the same land.

The resulting calculated measure areasize_calcarea_diff_percentage is then available in the list of measures and can be used in the ad hoc view. It is also possible to create hierarchies of calculated measures, i.e. using calculated measure in the definition of another one. This thus allows to define new attributes on-the-fly, based on available ones.
| These calculated measures are available only within the specific ad hoc view in which they are defined. If specific calculated measures should be available for all users and ad hoc views, then they should be created as calculated fields in the domain designer. |
The main ad hoc pane
Tables
Charts
Crosstabs
Filters
Save an ad hoc view and create a report
The following options are available when saving an ad hoc view:
- Save Ad Hoc View: saves changes made to a an already existing ad hoc view. If a new ad hoc view is saved, this option has the same behavior as Save Ad hoc View As....
- Save Ad Hoc View As...: saves a newly created ad hoc view (or allows to save an existing one with another name and/or in another folder). A repository folder needs to be selected as the location of the ad hoc view.
- Save Ad Hoc View and Create Report: this option allows saving the ad hoc view in a specific repository folder and the saving the analysis as a report into the same or another folder. Different names need to be specified for the ad hoc view and the report, event if they are saved into two different folders.

Edit an ad hoc view
An ad hoc view can be edited/changed by clicking on its name in the repository, or by selecting the row and clicking on Open. This opens the ad hoc view in the editor and allows changing the ad hoc view.
Export data
An ad hoc view in MINT can be used to export data from the database into a file. Any ad hoc view can be exported in the following formats:

MINT can thus be used as an easy to use shortcut for exporting data into an Excel file for example. When exporting data, the entire data from the ad hoc view gets exported, regardless if the option Sample Data or Full Data is chosen in the ad hoc view editor.
{{#switch:|subgroup|child=|none=|#default=
}}{{#if:Business Intelligence|{{#if:|<th scope="col" style="border-left:2px solid #fdfdfd;width:100%;|}}{{#if:|{{#if:Business Intelligence|}}}}{{#if:Install Staging Area Generator · Using Staging Area Generator · Post Processing SQL Scripts · SAG Spatial reference system · Name Rules Staging Area · Scheduling the Staging Area creation|{{#if:Business Intelligence|}}{{#if:|}}{{#if:Staging Area Generator|<td style="text-align:left;border-left-width:2px;border-left-style:solid;|{{#if:|}}}}{{#if: IMSMA Staging Area Database · Connecting to IMSMA Staging area from ArcGIS · Connecting to IMSMA Staging area from Excel · Sharing an IMSMA Staging Area|{{#if:Business IntelligenceInstall Staging Area Generator · Using Staging Area Generator · Post Processing SQL Scripts · SAG Spatial reference system · Name Rules Staging Area · Scheduling the Staging Area creation|}}{{#if:IMSMA Staging Area|<td style="text-align:left;border-left-width:2px;border-left-style:solid;|}}{{#if:|{{#if:Business IntelligenceInstall Staging Area Generator · Using Staging Area Generator · Post Processing SQL Scripts · SAG Spatial reference system · Name Rules Staging Area · Scheduling the Staging Area creation IMSMA Staging Area Database · Connecting to IMSMA Staging area from ArcGIS · Connecting to IMSMA Staging area from Excel · Sharing an IMSMA Staging Area|}}{{#if:|<td style="text-align:left;border-left-width:2px;border-left-style:solid;|}}{{#if:Other Reporting Tools|{{#if:Other Reporting Tools|<td style="text-align:left;border-left-width:2px;border-left-style:solid;|}}{{#if: Introduction to indicators|{{#if:Indicators|<td style="text-align:left;border-left-width:2px;border-left-style:solid;|}}{{#if:|{{#if:|<td style="text-align:left;border-left-width:2px;border-left-style:solid;|}}{{#if:|{{#if:|<td style="text-align:left;border-left-width:2px;border-left-style:solid;|}}{{#if:|{{#if:|<td style="text-align:left;border-left-width:2px;border-left-style:solid;|}}{{#if:|{{#if:|<td style="text-align:left;border-left-width:2px;border-left-style:solid;|}}{{#if:|{{#if:|<td style="text-align:left;border-left-width:2px;border-left-style:solid;|}}{{#if:|{{#if:|<td style="text-align:left;border-left-width:2px;border-left-style:solid;|}}{{#if:|{{#if:|<td style="text-align:left;border-left-width:2px;border-left-style:solid;|}}{{#if:|{{#if:|<td style="text-align:left;border-left-width:2px;border-left-style:solid;|}}{{#if:|{{#if:|<td style="text-align:left;border-left-width:2px;border-left-style:solid;|}}{{#if:|{{#if:|<td style="text-align:left;border-left-width:2px;border-left-style:solid;|}}{{#if:|{{#if:|<td style="text-align:left;border-left-width:2px;border-left-style:solid;|}}{{#if:|{{#if:|<td style="text-align:left;border-left-width:2px;border-left-style:solid;|}}{{#if:|{{#if:|<td style="text-align:left;border-left-width:2px;border-left-style:solid;|}}{{#if:|{{#if:|<td style="text-align:left;border-left-width:2px;border-left-style:solid;|}}{{#if:|{{#if:|<td style="text-align:left;border-left-width:2px;border-left-style:solid;|}}{{#if:|{{#if:Business IntelligenceInstall Staging Area Generator · Using Staging Area Generator · Post Processing SQL Scripts · SAG Spatial reference system · Name Rules Staging Area · Scheduling the Staging Area creation IMSMA Staging Area Database · Connecting to IMSMA Staging area from ArcGIS · Connecting to IMSMA Staging area from Excel · Sharing an IMSMA Staging Area|}}}}
|none=|#default= | ||||||||||||||||||||||||||||||||||||||||||||||||||||||||||||||||||||||||||||||||||||||||
}}{{#ifeq:|Template|{{#ifeq:|child||{{#ifeq:|subgroup||{{#switch:creating ad hoc views in mint
|doc
|sandbox
|testcases =
|#default = {{#switch:hlist
 |plainlist
 |hlist
 |hlist hnum
 |hlist vcard
 |vcard hlist =
 |#default =
 }}
}}
}}}}}}