Creating Reports in MINT
What is a report?
A report in MINT allows presenting data to an end-user. The data can be visualised as a table, chart or crosstab, or a combination of different elements. A MINT report can either be created offline using iReport or Jaspersoft Studio, or, more conveniently, it can be built online based on an ad hoc view. A report can be scheduled, i.e. it can be configured to run periodically, and the results can be stored in the repository and/or sent by email to a list of recipients.
Create a report from an ad hoc view
A report can be created from an ad hoc view in two different ways:
- When creating and saving the ad hoc view, click on the Save Ad Hoc View and Create Report option. A dialog then prompts for a name and location not only for the ad hoc view, but also for the report. As a result, the ad hoc view is then saved as a report in the specified repository location.
- Click on Create → Report in the top menu and follow these steps:
- In the Create Report window, select an ad hoc view to build the report on and click OK.
- The ad hoc view is then displayed as a report that can be saved by clicking on the save icon

Optionally, before saving the report a Custom Report Template can be chosen. There are some pre-defined templates corresponding to various formats (such as A4 and Letter Landscape/Portrait), but more customised templates can be created in Jaspersoft Studio and uploaded to MINT. A custom template may include a logo, specific fonts, colours, etc. Please contact your GICHD IM focal point if you wish to create a custom report template.

Interacting with a report
Filters / Input controls
If the underlying ad hoc view contains filters, then the end-user can interact with the report by changing the filter criteria. To do so, click on this icon in the top right corner of the report: ![]() . This icon is only enabled in the presence of filters. The Input Control window is then displayed and allows changing the filter criteria, depending on the filters that are defined in the underlying ad hoc view:
. This icon is only enabled in the presence of filters. The Input Control window is then displayed and allows changing the filter criteria, depending on the filters that are defined in the underlying ad hoc view:

Click Apply to only apply the filter or OK to apply it and exit the Input Control window.
Interacting with tables in a report (formatting, filtering and sorting)
If the report includes a table, several formatting options are available:

- Formatting: there are two format options:
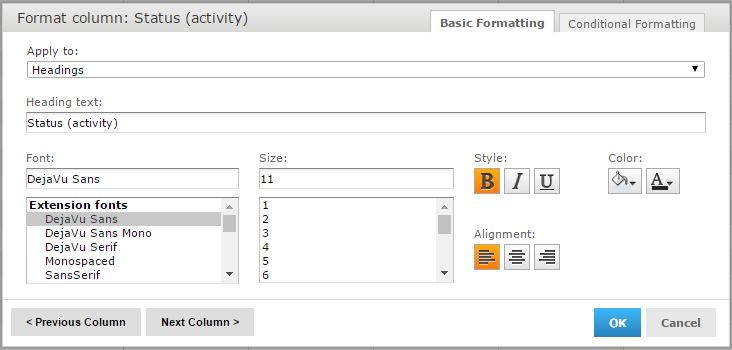
- Basic formatting: this dialog box allows to change headings, fonts, style, colours, etc.
- Conditional formatting: this dialog box allows to apply conditional formatting, i.e. apply styles such as text size, text colour and fill colour, based on certain criteria. For example, the background fill colour can be adapted to the value of the status attribute, as shown in the screenshot below:
- Column filters: allows to apply filters based on column values.
- Sort ascending/descending: allows to sort the column values ascending or descending.

