Difference between revisions of "Format an iReport Template"
(→Conditional Display) |
|||
| Line 22: | Line 22: | ||
To do this, you use conditional statements in the element on the iReport. | To do this, you use conditional statements in the element on the iReport. | ||
| − | # Select the desired in the iReport template ('''note:''' this is '''NOT''' the field value, but rather the text element on the report displaying the field value) | + | # Select the desired field or variable displayed in the iReport template ('''note:''' this is '''NOT''' the field or variable value itself in the '''iReport Designer''', but rather the text element on the report displaying the field or variable value). |
| + | #: [[Image:IReport Display Properties.png|center|300px|''Display Properties'']]<div align="center">''Display Properties''</div> | ||
# On the '''Properties''' pane select the '''Text Expression''' and open the '''Text Expression Editor''''. | # On the '''Properties''' pane select the '''Text Expression''' and open the '''Text Expression Editor''''. | ||
#: [[Image:IReport Charts5.png|center|500px|''Text Expression Editor'']]<div align="center">''Text Expression Editor''</div> | #: [[Image:IReport Charts5.png|center|500px|''Text Expression Editor'']]<div align="center">''Text Expression Editor''</div> | ||
| Line 35: | Line 36: | ||
Example: | Example: | ||
$F{blockWater} == null ? “No value" : $F{blockWater} | $F{blockWater} == null ? “No value" : $F{blockWater} | ||
| + | |||
| + | ==Formatting Dates and Numbers== | ||
| + | iReport Designer allows you to apply specific date or number formats to fields of this type. As with other display properties: | ||
| + | # Select the desired field or variable displayed in the iReport template ('''note:''' this is '''NOT''' the field or variable value itself in the '''iReport Designer''', but rather the text element on the report displaying the field value) | ||
| + | #: [[Image:IReport Display Properties.png|center|300px|''Display Properties'']]<div align="center">''Display Properties''</div> | ||
| + | # On the '''Properties''' pane select the '''Pattern''' element and open the '''Pattern Editor''''. | ||
| + | #: [[Image:IReport Pattern Properties.png|center|300px|''Pattern Window'']]<div align="center">''Pattern Window''</div> | ||
| + | #: Choose an appropriate '''Pattern''' to apply to the field as desired. | ||
==Adding Formatting Elements== | ==Adding Formatting Elements== | ||
| − | + | Additional formatting elements can be added to the iReport template. These include lines, boxes, circles, etc. To add these elements to iReport template: | |
| + | # Ensure that '''Palette''' pane is available. If not, on the '''Window''' menu, select '''Palette'''. | ||
| + | # Select the desired element and drag it to the iReport template. | ||
==Formatting Tools== | ==Formatting Tools== | ||
| − | * float | + | iReport Designer provides a variety of formatting tools for aligning, spacing, and sizing elements on the report template. These can be applied using the '''Formatting Tools''' pane. |
| + | # Ensure that '''Formatting Tools''' pane is available. If not, on the '''Window''' menu, select '''Formatting Tools'''. | ||
| + | #: [[Image:IReport Formatting Tools.png|center|300px|''Formatting Tools'']]<div align="center">''Formatting Tools''</div> | ||
| + | # Select the desired element or elements (multiple elements can be selected by using the '''Control-click''' key combination) and apply the desired formatting choice. | ||
| + | |||
| + | =="fix relative to" vs. "float"== | ||
| + | Because iReport elements can expand beyond their expected or allocated vertical space on the report template, elements can occasionally "collide" or overlap one another in the final report. To manage the potential conflict iReport provides the '''Position Type''' property on all elements. | ||
| + | [[Image:IReport Display Properties.png|center|300px|''Formatting Tools'']]<div align="center">''Formatting Tools''</div> | ||
| + | |||
| + | The '''Position Type''' property has three options: | ||
| + | *"fix relative to top": This is the default value for all elements and means that the position will be kept relative to the top margin of the report regardless of what data is displayed before it. | ||
| + | *"fix relative to bottom": This value means that the position will be kept relative to the bottom margin of the report regardless of what data is displayed after it. | ||
| + | *"float": This value allows the element to "float" and will display the element relative to elements that come before it (i.e. closer to the top or closer to the left margins). | ||
| + | |||
| + | Using the '''float''' Position Type can help eliminate the overlapping that can occur when displaying multiple charts or cross tabs in a single report template. | ||
| + | |||
| − | |||
| − | |||
{{NavBox HowTo use iReport}} | {{NavBox HowTo use iReport}} | ||
Revision as of 02:03, 22 September 2013
| How To |
|---|
iReport Designer provides many ways to format the appearance of an iReport template. These include the ability to:
- add formatting elements to the iReport such as lines, rectangles, circles, etc
- edit the position and size of elements on the iReport template relative to one another
- change colors, fonts, and other properties
- perform conditional displays based on data in the report
Conditional Display
Sometimes it is important to change the display of some data extracted from IMSMA for the resulting report. For example, you want to change:
- the value “null” to “no”
- the value “Male” to “Men”
To do this, you use conditional statements in the element on the iReport.
- Select the desired field or variable displayed in the iReport template (note: this is NOT the field or variable value itself in the iReport Designer, but rather the text element on the report displaying the field or variable value).
-
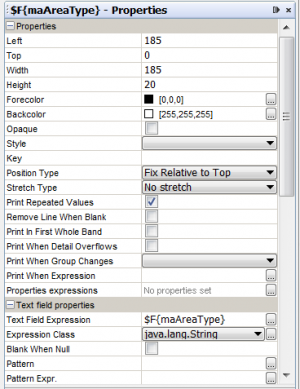 Display Properties
-
- On the Properties pane select the Text Expression and open the Text Expression Editor'.
-
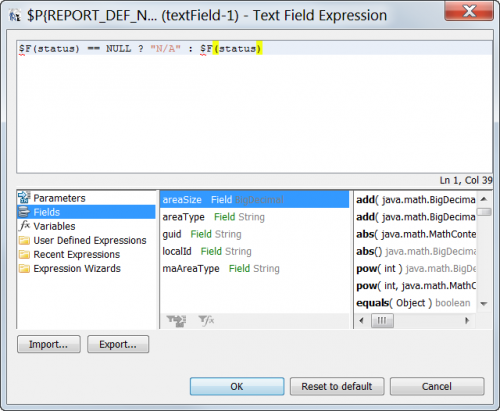 Text Expression Editor
-
- To change the way a particular field is displayed you can use basic "ïf-then-else" logic as in other Variable Expressions. This follows the pattern:

$F{field} == null ? “Something" : $F{field}
Or nested:
$F{field} == null ? “Something" : $F{field} == “SomethingElse” ? “Something Else“ : $F{field}
| |
The type of field is important (string, float, double, int, date). Stick with strings if you can. |
Example:
$F{blockWater} == null ? “No value" : $F{blockWater}
Formatting Dates and Numbers
iReport Designer allows you to apply specific date or number formats to fields of this type. As with other display properties:
- Select the desired field or variable displayed in the iReport template (note: this is NOT the field or variable value itself in the iReport Designer, but rather the text element on the report displaying the field value)
- Display Properties
-
- On the Properties pane select the Pattern element and open the Pattern Editor'.
-
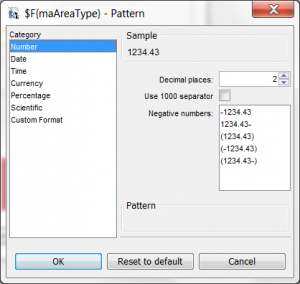 Pattern Window
 - Choose an appropriate Pattern to apply to the field as desired.
-

Adding Formatting Elements
Additional formatting elements can be added to the iReport template. These include lines, boxes, circles, etc. To add these elements to iReport template:
- Ensure that Palette pane is available. If not, on the Window menu, select Palette.
- Select the desired element and drag it to the iReport template.
Formatting Tools
iReport Designer provides a variety of formatting tools for aligning, spacing, and sizing elements on the report template. These can be applied using the Formatting Tools pane.
- Ensure that Formatting Tools pane is available. If not, on the Window menu, select Formatting Tools.
-
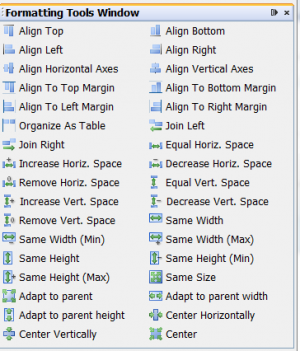 Formatting Tools
-
- Select the desired element or elements (multiple elements can be selected by using the Control-click key combination) and apply the desired formatting choice.

"fix relative to" vs. "float"
Because iReport elements can expand beyond their expected or allocated vertical space on the report template, elements can occasionally "collide" or overlap one another in the final report. To manage the potential conflict iReport provides the Position Type property on all elements.

The Position Type property has three options:
- "fix relative to top": This is the default value for all elements and means that the position will be kept relative to the top margin of the report regardless of what data is displayed before it.
- "fix relative to bottom": This value means that the position will be kept relative to the bottom margin of the report regardless of what data is displayed after it.
- "float": This value allows the element to "float" and will display the element relative to elements that come before it (i.e. closer to the top or closer to the left margins).
Using the float Position Type can help eliminate the overlapping that can occur when displaying multiple charts or cross tabs in a single report template.