MINT Examples and Exercises: Difference between revisions
No edit summary |
No edit summary |
||
| (4 intermediate revisions by one other user not shown) | |||
| Line 3: | Line 3: | ||
In each participant's organisation, a Data Source named '''Staging Area Tajikistan''' has been created. A domain called '''Land''' has been created in the /Ad Hoc Components/Domains folder in each organization's repository. This domain contains attributes of Land (hazards) from the IMSMA staging area from Tajikistan. <br /> | In each participant's organisation, a Data Source named '''Staging Area Tajikistan''' has been created. A domain called '''Land''' has been created in the /Ad Hoc Components/Domains folder in each organization's repository. This domain contains attributes of Land (hazards) from the IMSMA staging area from Tajikistan. <br /> | ||
Create an Ad Hoc View based on the Land Domain and get familiar with the available data. Then, explore the data in more detail in order to find answers to the following questions: | Create an Ad Hoc View based on the Land Domain and get familiar with the available data. Then, explore the data in more detail in order to find answers to the following questions: | ||
== Creating a Land Domain ==__NOEDITSECTION__ | |||
<ol> | |||
<li>Create a domain accessing the Staging Area Tajikistan</li> | |||
<li>Include the following tables in the domain:</li> | |||
<ol> | |||
<li>Hazard</li> | |||
<li>Organisation</li> | |||
</ol> | |||
<li>Join the two tables (which type of join? on which attribute?)</li> | |||
<li>For now, no derived table, no calculated field and no pre-filter</li> | |||
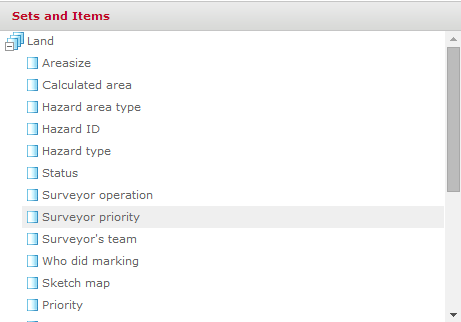
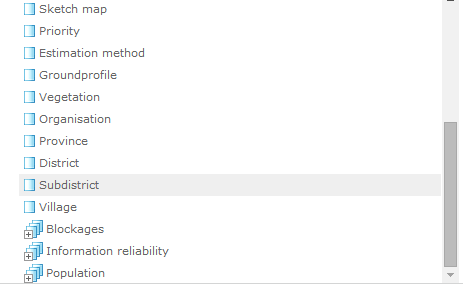
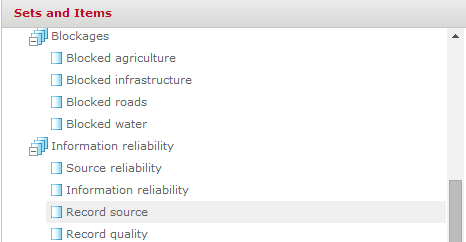
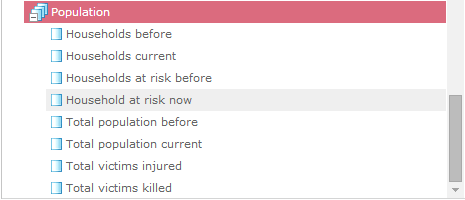
<li>Include and display the following attributes: | |||
[[File:MINT_example_1.png|center]] | |||
[[File:MINT_example2.png|center]] | |||
[[File:MINT_example_3.png|center]] | |||
[[File:MINT_example_4.png|center]] | |||
</li> | |||
</ol> | |||
== Exploring the Land Domain ==__NOEDITSECTION__ | |||
<ol> | <ol> | ||
<li>How many hazards are there in total, by status?</li> | <li>How many hazards are there in total, by status?</li> | ||
| Line 20: | Line 39: | ||
<li>Before producing a chart, describe the relationship between a hazard and devices (in terms of one-to-one, one-to-many, etc.). What could that mean for the analysis. ''Hint: have a closer look at the hazard with the ID '''HZ TJ-24''' for example.</li> | <li>Before producing a chart, describe the relationship between a hazard and devices (in terms of one-to-one, one-to-many, etc.). What could that mean for the analysis. ''Hint: have a closer look at the hazard with the ID '''HZ TJ-24''' for example.</li> | ||
<li>What is the issue here and how could it be solved? After thoughts and discussion, click [[MINT Example Contamination Type|here]] for a possible solution.</li> | <li>What is the issue here and how could it be solved? After thoughts and discussion, click [[MINT Example Contamination Type|here]] for a possible solution.</li> | ||
<li>Are there any other interesting measures/indicators that you would like to show based on the available data?</li> | |||
</ol> | |||
== Including Activities (hazard reduction) ==__NOEDITSECTION__ | |||
Now that we have explored the Land attributes, we would like to analyse which activities have been carried out on the hazards. | |||
<ol> | |||
<li>Edit the Land domain and include attributes from activities</li> | |||
<ol> | |||
<li>Which tables do you need to join to the existing ones? Take into account that we would like to look into NTS efficiency, thus numbers of devices are an interesting measure too.</li> | |||
<li>Inspect the available attributes for activities and choose pertinent ones. ''Hint: be sure to include the following (and others):''</li> | |||
<ul> | |||
<li>end_report_period</li> | |||
<li>reduced_manual</li> | |||
<li>cleared_manual</li> | |||
<li>cleared_mdd</li> | |||
<li>area_released</li> | |||
<li>type_of_report</li> | |||
</ul> | |||
<li>Create a new set with activity attributes, at the same level as the ''Land'' set (not a sub-set)</li> | |||
</ol> | |||
<li>Test and explore the domain, dragging attributes from Land only, from Activity only, and then from both sets.</li> | |||
</ol> | </ol> | ||
{{NavBox | {{NavBox Hub}} | ||
[[Category:NoPublic]] | [[Category:NoPublic]] | ||
Latest revision as of 21:19, 20 February 2020
In each participant's organisation, a Data Source named Staging Area Tajikistan has been created. A domain called Land has been created in the /Ad Hoc Components/Domains folder in each organization's repository. This domain contains attributes of Land (hazards) from the IMSMA staging area from Tajikistan.
Create an Ad Hoc View based on the Land Domain and get familiar with the available data. Then, explore the data in more detail in order to find answers to the following questions:
Creating a Land Domain
- Create a domain accessing the Staging Area Tajikistan
- Include the following tables in the domain:
- Hazard
- Organisation
- Join the two tables (which type of join? on which attribute?)
- For now, no derived table, no calculated field and no pre-filter
- Include and display the following attributes:


Exploring the Land Domain
- How many hazards are there in total, by status?
- What is the total (sum) of the areasize by hazard status?
- Same question for the calculated area?
- Identify those hazards where the difference between the areasize and the calculated area is big. Hint: use a table, create a custom field, sort the records
- Is this difference somehow related to the estimation method and/or the existence of a sketch map?
- List all the open hazards that have a high priority assigned. If you had to prioritize those now, which other attribute could you consider? This question is not about how a prioritization should be made, but about how data can be analysed in order to inform the prioritization process.
- Based on the data available in the Land domain, which organisations seem to be active in the country?
- Show the extent of contamination by province in an appropriate chart
One of the indicators mentioned during the brainstorming on the first day of the training is the following: Sqkm by province and device. Let's try to get this displayed step-by-step:
- What data is missing in the Land domain to get to this indicator?
- Edit the domain and add the required data
- Before producing a chart, describe the relationship between a hazard and devices (in terms of one-to-one, one-to-many, etc.). What could that mean for the analysis. Hint: have a closer look at the hazard with the ID HZ TJ-24 for example.
- What is the issue here and how could it be solved? After thoughts and discussion, click here for a possible solution.
- Are there any other interesting measures/indicators that you would like to show based on the available data?
Including Activities (hazard reduction)
Now that we have explored the Land attributes, we would like to analyse which activities have been carried out on the hazards.
- Edit the Land domain and include attributes from activities
- Which tables do you need to join to the existing ones? Take into account that we would like to look into NTS efficiency, thus numbers of devices are an interesting measure too.
- Inspect the available attributes for activities and choose pertinent ones. Hint: be sure to include the following (and others):
- end_report_period
- reduced_manual
- cleared_manual
- cleared_mdd
- area_released
- type_of_report
- Create a new set with activity attributes, at the same level as the Land set (not a sub-set)
- Test and explore the domain, dragging attributes from Land only, from Activity only, and then from both sets.