Difference between revisions of "Create a Basic iReport Template"
| Line 75: | Line 75: | ||
<ol type="a" start="2"> | <ol type="a" start="2"> | ||
<li>Click the '''Next''': | <li>Click the '''Next''': | ||
| − | The window to group the report data displays. The [[Modify an iReport Template# | + | The window to group the report data displays. The [[Modify an iReport Template#Sorting_and_Grouping|group by]] step allows you to list item records that have the same value for the selected group by field together in the report. |
| − | |||
| − | |||
| − | |||
<ol start="6"> | <ol start="6"> | ||
| Line 84: | Line 81: | ||
</ol> | </ol> | ||
| − | {{note|If you choose to group the report data, you may also want to sort the data using the attribute. For more information on sorting, refer to | + | {{note|If you choose to group the report data, you may also want to sort the data using the attribute. For more information on sorting, refer to [[Modify an iReport Template#Sorting_and_Grouping|sorting]].}} |
<ol start="7"> | <ol start="7"> | ||
| − | <li>Click the '''Next''' button | + | <li>Click the '''Next''' button and then '''Finish'''</li> |
| − | + | The Wizard is complete and the iReport template designer window is open. Depending on your selections your template will look different from the example below. | |
| − | + | [[Image:iReportHome1.png|center|500px|''Figure 2. iReport Wizard - Final Step'']] | |
| − | |||
| − | |||
| − | |||
| − | '' | ||
| − | </ | ||
| − | |||
| − | |||
| − | |||
| − | [[Image: | ||
<div align="center"> | <div align="center"> | ||
| − | ''Figure | + | ''Figure 3. iReport Wizard - Final Step'' |
| − | |||
| − | |||
| − | |||
| − | |||
| − | |||
| − | |||
| − | |||
| − | |||
| − | |||
| − | |||
| − | |||
| − | |||
| − | |||
| − | |||
| − | |||
| − | |||
| − | |||
| − | |||
| − | |||
| − | |||
| − | |||
| − | |||
| − | |||
| − | |||
| − | |||
| − | |||
===Grouping===__NOEDITSECTION__ | ===Grouping===__NOEDITSECTION__ | ||
Revision as of 20:00, 16 September 2013
| How To |
|---|
Creating a Basic Report Using the Wizard
IMSMANG provides an iReport Wizard to help in the process of creating new iReport templates.
To create a report:
- From the File menu, select New....
- The iReport Wizard window displays.
- From the Report Templates list, select the template you would like to use for your report. Blank A4 or an IMSMA specific template are preferrable

Figure 1. iReport Wizard – Step 1
- Click the Launch Report Wizard button.
- The window to name the report and file location displays.

Figure 2. iReport Wizard - Step 2
- Select the desired Data Source for the report and choose Next

Figure 3. iReport Wizard - Step 3
- Select the desired data fields for the report and choose Next

Figure 3. iReport Wizard - Step 4
| Table 2. iReport Wizard – Buttons for selecting fields | |
| Button | Description |
| |
Includes the selected field in the report. |
| |
Includes data for all fields in the report. |
| |
Removes the selected field from the report. |
| |
Indicates all fields from the report. |
| |
It is recommended to always include the guid field when designing a report |
- Click the Next:
The window to group the report data displays. The group by step allows you to list item records that have the same value for the selected group by field together in the report.
- If you would like to group the report data, select the attribute on which you would like to group the data from the Group list.

If you choose to group the report data, you may also want to sort the data using the attribute. For more information on sorting, refer to sorting. - Click the Next button and then Finish
The Wizard is complete and the iReport template designer window is open. Depending on your selections your template will look different from the example below.
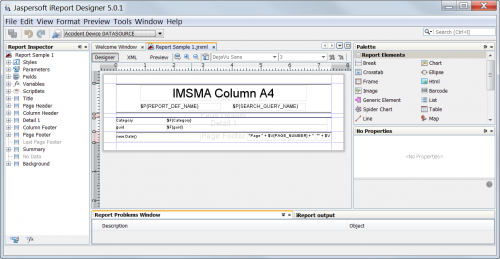
Figure 3. iReport Wizard - Final Step
Grouping
Grouping allows you to organise the report results using the values of a particular field. Grouping results makes it easier to identify the records which share a common value. Rather than having to visually scan the report results to determine which records have a common value, grouping automatically organises the results for you.
To illustrate, suppose you wanted to create a report to list all land within each location ID. The procedures that have been discussed so far in this training module would simply list all land along with their location ID. Although the location ID is included in the report, it would be difficult, tedious, and time-consuming to scan the entire report to identify those land that have a common location ID.
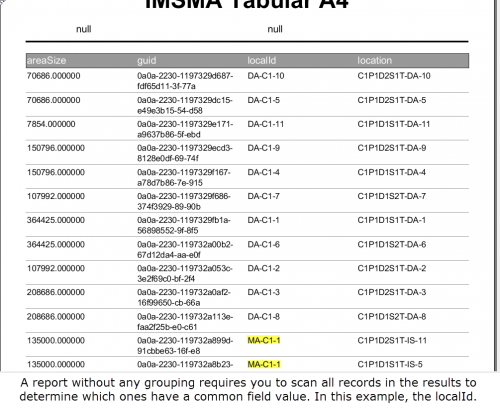
Figure 7. Land report with no grouping
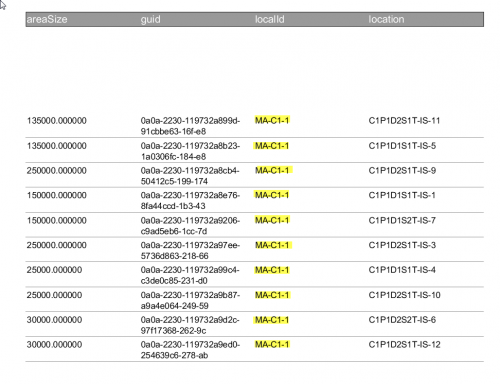
Grouping report results automatically organises the records using the values on the specified field. Using the example above, the land in the report shown in Figure 8 are organised within the location to which they are associated. Records that do not contain a value for the selected grouping are put into their own group.
 Template:NavBox HowTo use iReport
Land grouped by location


