Format an iReport Template
| How To |
|---|
iReport Designer provides many ways to format the appearance of an iReport template. These include the ability to:
- add formatting elements to the iReport such as lines, rectangles, circles, etc
- edit the position and size of elements on the iReport template relative to one another
- change colors, fonts, and other properties
- perform conditional displays based on data in the report
Contents
Conditional Display
Sometimes it is important to change the display of some data extracted from IMSMA for the resulting report. For example, you want to change:
- the value “null” to “no”
- the value “Male” to “Men”
To do this, you use conditional statements in the element on the iReport.
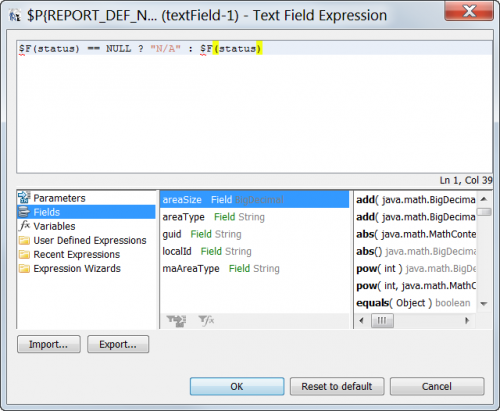
- Select the desired in the iReport template (note: this is NOT the field value, but rather the text element on the report displaying the field value)
- On the Properties pane select the Text Expression and open the Text Expression Editor'.
- Text Expression Editor
-
- To change the way a particular field is displayed you can use basic "ïf-then-else" logic as in other Variable Expressions. This follows the pattern:
$F{field} == null ? “Something" : $F{field}
Or nested:
$F{field} == null ? “Something" : $F{field} == “SomethingElse” ? “Something Else“ : $F{field}
| |
The type of field is important (string, float, double, int, date). Stick with strings if you can. |
Example:
$F{blockWater} == null ? “No value" : $F{blockWater}
Adding Formatting Elements
- Adding lines
Formatting Tools
- float vs fix relative
